Leap Day
Recently, our local newspaper ran a short article highlighting a "Leapling" born on Leap Day in a local hospital, and said that such an event was rare, occurring with a rate of only 1 in . Naturally they got this number from:
Unfortunately, as we'll be able to show below, this claim is demonstrably false! It also offers an opportunity to share some interesting stories, and give us an excuse for introducing the basics of statistics.
Gregorian Calendar
First, I feel as though many people have forgotten the relevance and difference between the Julian and Gregorian calendars. In the western calendar, Thursday October 4, 1582 was followed by Friday October 15, 1582. There were 10 days that never happened.
We all know the current calendar used in the Western world consists of 365 days, but with a leap day inserted at the end of February in every year divisible by 4. Except, that isn't the current calendar of the western world. What I just described was the Julian calendar, first proposed by Julius Caeser, which was in effect started on January 1, 45 BC (by our count). This calendar has an average year length of 365.25 days, and has a leap day every days (as in the paper's claim). Unfortunately, this doesn't align perfectly with the 365.2522 day tropical year.[1]
Because of this misalignment, every years, the Julian calendar drifts a day with respect to the equinoxes and solstices. By the 1500s, since we had been using the Julian calendar for more than a millenia, it had drifted a dozen days or so since it was established. This created an issue for the Catholic church, which used the computus to calculate the date of Easter. By 1582, the discrepency in dates was unacceptable to the Church, and Pope Gregory XIII would institute the Gregorian Calendar which tried to bring the calendar into better alignment with the tropical year by deleting a leap year every century and then re-inserting it back every 400 years. To correct for the perceived drift, a ten day leap was inserted, making the day after Thursday October 4, 1582: Friday October 15, 1582.
So, for the current calendar used by most of the Western world, if the year is divisible by 4, it is a leap year, unless it is also divisible by 100, in which case it is a normal year, unless it is also divisible by 400, in which case it is indeed a leap year.
This puts us at an interesting time in the Gregorian calendar, since the year 2000 was one of these rare, doubly modified years and so was an ordinary leap year. Essentially no one alive today was around to observe the last leap day removal in 1900, and few of us will be around to above the next one in 2100, but it is important on the time scales of centuries that we follow the Gregorian rather than Julian calendar and that has helped keep our seasons, equinoxes and solstices aligned with fixed dates.
Obnoxious Precision
The Gregorian calendar repeats every 400 years, or 146,097 days in which there are 97 leap days. If we wanted to be erroneously pedantic, we could take issue with the newspaper's claim of 1 in leaplings by saying that for the Gregorian calendar leap days occur instead every 97 out of 146097 days or 1 in .
Of course, this is annoying. It is also wrong. It harkens back to grading freshman physics homework solutions where students would report their answers with 9 decimal places as they would simply write down all 10 digits their calculator would display. Above, I gave the odds of a leaping with 10 significant digits, specifying it to a precision of 0.0000005 days or 40 milliseconds! That's absurd. However, it is also absurd to claim that leaplings occur at a rate of 1 in despite the better decimal habits.
Why? Because as we said above, essentially no one alive today was around to see the last leap day deletion. For people we interact with it is more correct to say that the ratio of leaplings is 1 in than it is to say its 1 in , as that is a better model of the reality of the situation.
Better Models
Of course, if we are interested in making appeals to reality, why don't we actually take a look at some data. It's well known that birth rates are not uniform across the year and that they show seasonal, weekly and even data specific influences. Gelman et al. even used a hierarchical Bayesian model of these effects as the cover of their book:
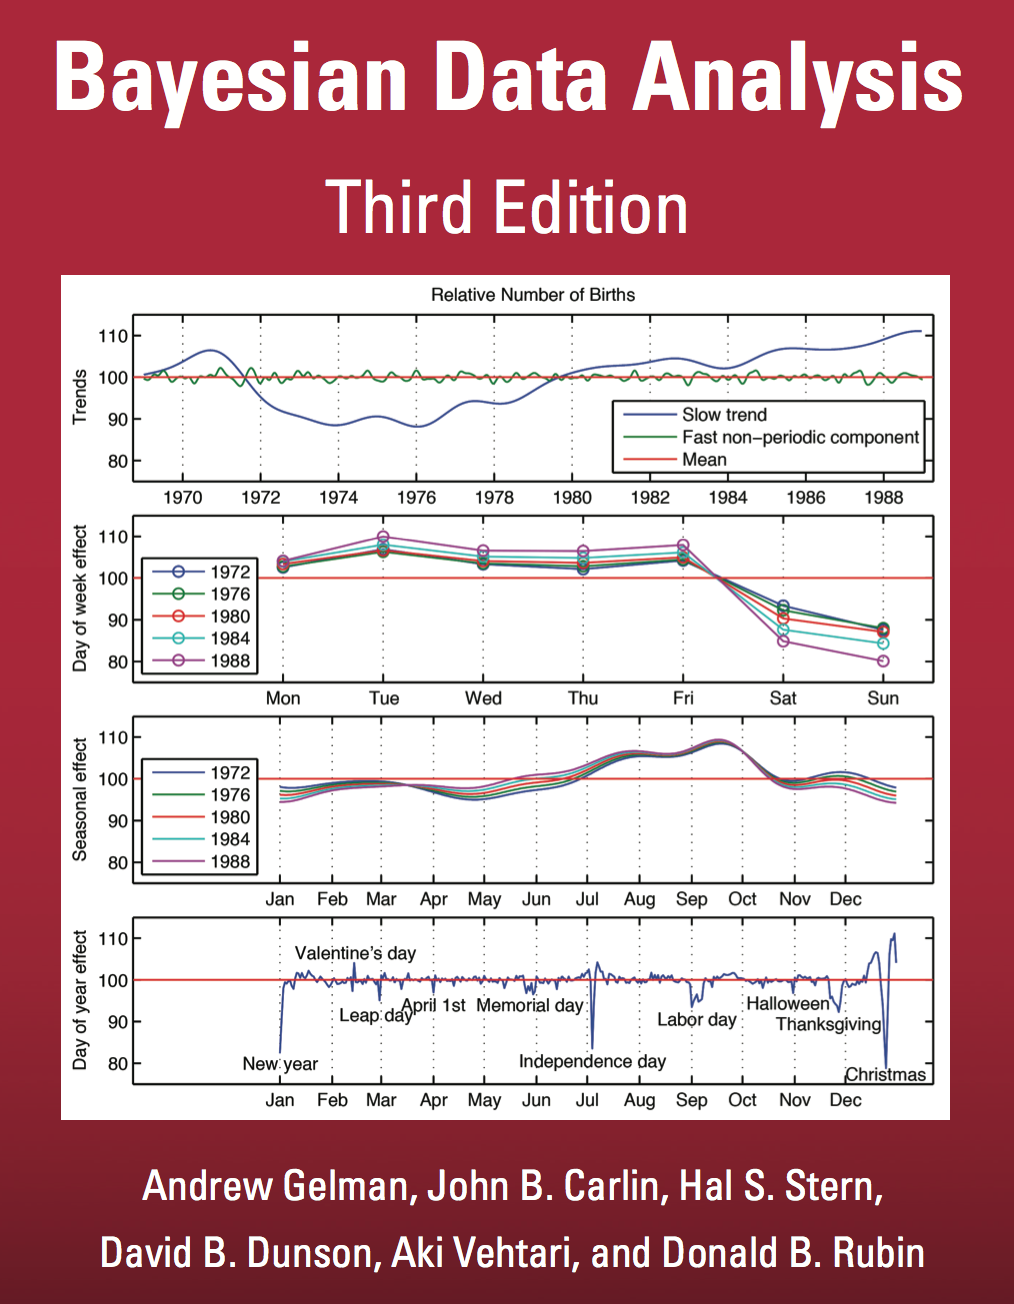
Even on the cover we can see that there is a Leap Day specific supression of births, more than you would expect from simply the rarity of leap days.
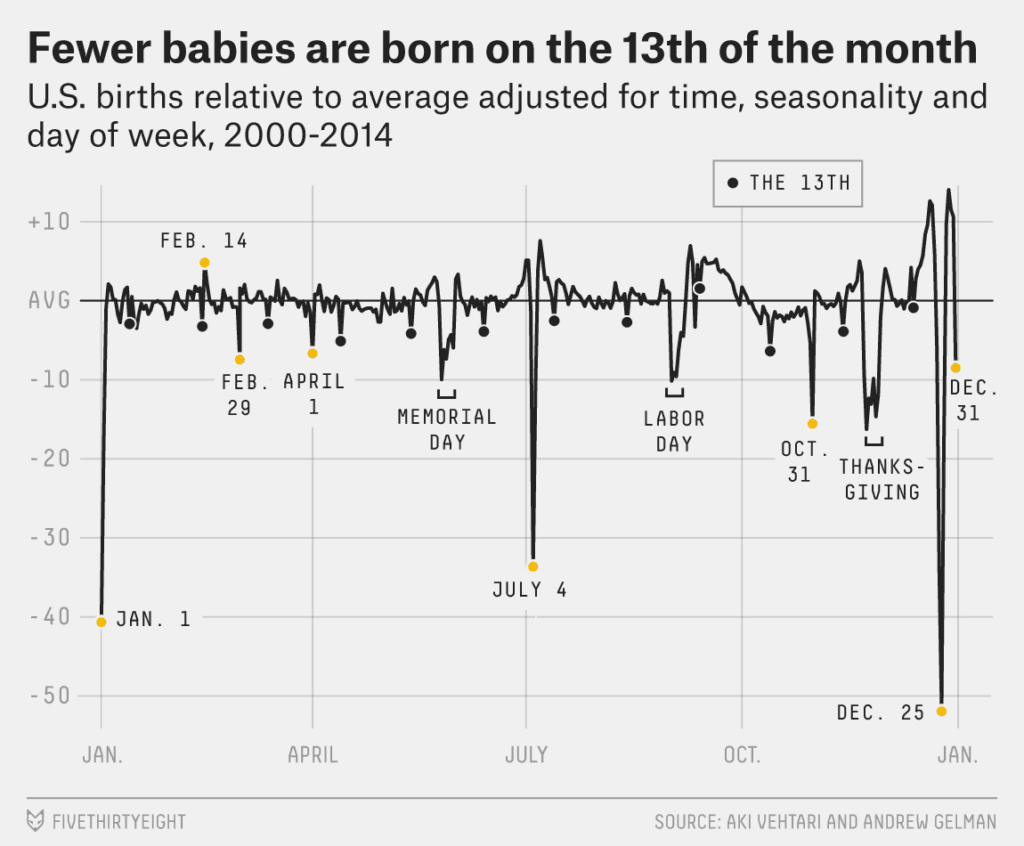
In a followup analysis, the effects got even stronger:
Observations
But, in order to get a good estimate of the rarity of leaplings, we don't have to do a fancy hierarchical model, we can just look at the data directly. We'll use the same data as in the reanalysis, available here, consisting of births from 2000 to 2014 collected by the US Social Security Administration.
In this data there are a total of babies: babies born on leap days compared to babies born on non-leapdays over 14 years. Is this consistent with the papers claim of 1 in ?
Let's try to calculate an estimate of the rate from the data, accounting for the fact that the data doesn't contain an even number of leap year cycles. We can look at the average number of babies born on a nonleapday, multiply that up by 1460 and compare it to the number of leaplings born per leapday on average to get an empirical estimate of the leapling rate.
function estimateRate(leaplings) {
	const nonLeaplings = totalBirths - leaplings;
	return ((nonLeaplings / nonLeapDays) * 1460) / (leaplings / leapDays);
}

const empiricalLeaplingRate = estimateRate(leaplings)
In our data, this estimate is . This certaintly isn't exactly the reported in the newspaper, but is it consistent? The data we have are random and any time we collect a dataset like this we would expect some fluctuations. Could it be that our observed deviation is just a random fluctuation that took us away from ?
Statistical Significance and the Nature of Statistical Argument
To answer that, let's try to do statistics properly. We'll imagine replacing our data with data we would be just as happy with under the null hypothesis: in this case the assumption that births are equally likely on every date. To do that, we can simply shuffle our data in the appropriate way. Imagine taking all of the births in this dataset and randomly assigning them to a date within the interval of the dataset, then we could recalculate our corrected estimate from that shuffled dataset and see what we get.
A single simulation gives us a single estimate:
estimateRate(d3.randomBinomial(totalBirths, leapDays/totalDays)())
Doing this times we get a whole dataset of simulated values:
Which we can plot as a histogram, along with both the we simulated (black dashed), as well as our observed estimate from the data (red). Notice that the claim that our observed leapling rate varied away from because of a random fluctuation is incredulous. That just isn't possible. There is no way we would have observed such a fluctuation.
What we've just done is the very heart of statistical argument. We had some null hypothesis we believed might apply, namely that births are uniformly distributed across days, and we had an empirical estimate of the observed rate of births on leap days (correcting for the 4 year calendar cycle), and we wanted to ask whether the observation we made was consistent with the null hypothesis. To do this, we had to replace our data with data we deemed admissible under the null hypothesis: in this case, if the dates don't matter, we could have taken our dataset of births and shuffled the associated birth day for each of them and that should have been just as likely a dataset under the null hypothesis. We simulated this and for each simulation computed the same statistic we had computed on the original dataset. The final determination we need to make is as to whether or not the observation we made (red line) could have been a fair samply from the sampling distribution under the null hypothesis. In this case, it's clear it isn't.
Bootstrapping and Confidence Intervals
We've decided we can clearly rule the newspapers claim as false, but if we were going to write the article, what value should we give? We could give the we observed, but again, given the stochastic or random nature of data, we should attempt to report more than a single number that we would believe represents the true leapling rate.
We'd like to instead report something like a distribution for our beliefs, which values would we allow and to what degree? Unfortunately we have but the one dataset, how can we turn that into a distribution of measurements?
The bootstrapping comes to our rescue. Again, the core idea is simple, let's fix the glitch. We only had one dataset, so let's fix that and create a whole slew of datasets that we would just as credible as the one we have. A general purpose way to do that is to resample our data with replacement. Imagine taking every one of these births and putting them into a hat. If we drew out all births, one at a time, we would exactly recreate our dataset (albeit in a random order), but we can generate a new dataset that is just as credible if we put those in our hat and draw out a total of from the hat, but ensure we replace each after we draw it out, meaning it could reoccur.
There is an approximation happening here, we are modelling the data in some capacity, in this case the model turns out to be equivalent to trusting the empirical data distribution as if it were the proper data generating distribution, but its a fairly inoccuous assumption. We don't need to say that our data is Gaussian, or anything about its moments or tail behavior, we are simply drawing out the data that was observed, whatever distribution that may have been drawn from, we simply allow that those births could reoccur with a rate of 1 to .
We can simulate this process efficiently by judicious use of a Binomial Distribution:
const bootstrapEstimate = Float64Array.from({length: 25_000},
	() => estimateRate(d3.randomBinomial(totalBirths, leaplings/totalBirths)()))
This distribution represents our belief in what sort of leapling rates we should treat as being consistent with the data we observed. The histogram does a better job of showing that belief and whatever sort of shape it has, but if we were looking for a way to summarize this distribution we summarize it with an interval, say a 90% interval by saying that 90% of these credible values lie between: and .
Notice again that this interval doesn't include the newspapers value of 1461!
Appendix - Just how sure can we be?
We saw above that when we tried to randomly permute the data's labels, the assertion that we would observe a value as high as if the true rate was 1461 in a dataset of was incredulous. Just how unlikely would that be?
To answer that we can use Sanov's Theorem and say that the probability of observing such a large deviation is approximately:
which in this case works out to be the vanishingly small !!
The tropical year is the time it takes for the sun to return to the same point in the sky, which happens 20 minutes sooner than when the Earth finishes its journey around the Sun, aka, the sidereal year because of the precession of the equinoxes) ↩︎